
Back in 2006 I took a statistics class at a local junior college as part of my transfer program to finally finish my college degree. I needed to find a statistically interesting set of stats to study for my final class report. It took a while to decide but I remembered something weird. My wife learned a habit from her father: when you fill up with gas, always write down the information in a note pad for future reference. She records gas fill-ups, oil changes, brake and tire replacements, any service done on the car, etc. The information looks like this...
 Car Mileage Recond
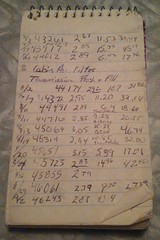
It is a simple spreadsheet in a spiral notebook. The data fields are date, mileage, fuel cost, gallons purchased, and dollars spent. You will also notice the notation of an air filter replacement and tranmission fluid flush/fill.
Using this data I came up with a range of interesting statistics:
- Miles per gallon
- Average miles driven per day/month/year
- Dollars spent per day on fuel
- Miles/time between oil changes
Since I always buy gas from the same place (when possible) the data also show the historical price per gallon in a fairly accurate way (regular unleaded). One of these days I'll post on my blog the results of the study I did regarding the relationship between gas prices, my driving habits, and my fuel buying habits.
Since putting all this data into Excel is a bit arduous I do it about once a year. This time around I found it had been 3 years since my last update to my ever-growing spreadsheet. I did buy the car new 14 years ago! (1998 Subaru Legacy L wagon)
What did I find out this year?
- Average miles driven per day: declined 3 years running to 19.71. This is the lowest level since 2003 (18.84) and a significant drop over 2007 (27.33).
- Total miles per year: same decline as #1, following the same trend. The high in 2007 was 9974 while the low in 2010 was 7195.
- Gallons purchased followed the same pattern as miles driven but the changes in dollars spent was amplified by the volitility of fuel prices. 2008 was a lower mileage year than 2007 but a spike in gas prices in 2008 raised total fuel purchased to $1416, a $91 increase over 2007, and $387 higher than 2010 ($1029).
Bike mileage -
- 2007-08: 1475, avg. 737 per year (missed about 300 miles before I purchased my first odometer)
- 2009: 1727 = 784 (old odometer) + 943 (garmin.com, includes 450 miles for 2009 Cycle Oregon)
- 2010: 950 miles
Conclusions:
- I'm a major nerd. Anyone who knows me will confirm that fact.
- Buying my bike in 2007 dramatically reduced the miles I drive per year. 2003 was the year after our twins were born so we didn't go very far that year (not much other than commuting, plus vacation and 1 month infant care leave, all spent at home).
- As my bike commute miles stack up the miles driven in my car continue to decline.
- Gas prices are fairly volitale but still below the high of a couple years ago ($4.35 on June 26, 2008)
- My crash in August 2010 really put a dent in my annual biking mileage but not my car mileage.
The rest of this year should be even better than '09 as long as I stay injury free. I signed up for Cycle Oregon again this year, which should add another 500 miles, and I'm already above 200 miles for 2011 YTD. Maybe I can reach 2000 miles for the year?
Sorry Kris, I got nothin' on you...
 Daily Mile Blog entry about Kris R, a guy I know from work.